Solving for a Constant in Equivalent Rational Expressions
One way rational expressions appear on the SAT is in problems that ask you to determine the value of a constant that makes two rational expressions equivalent. Here's an example:
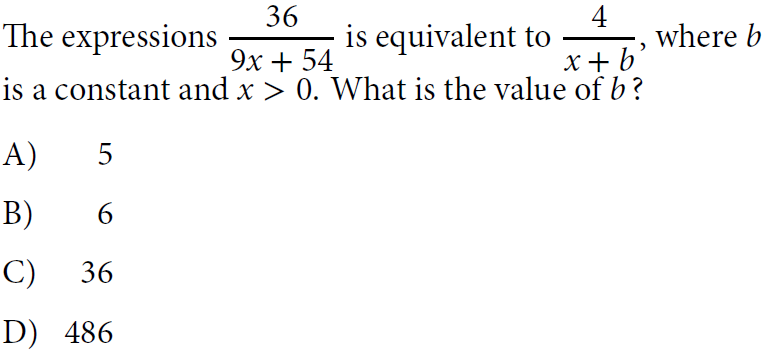
This is a simple problem to solve algebraically; you can observe that the second expression is just 9 times the first. However, if you don't notice that, and you're unsure how to proceed to actually solving for b (which is admittedly time-consuming), you can use either regression or graphing to find the answer. To use regression, create a list of test values for the variable (we use x₁) and enter the equivalence in the form of a regression statement; Desmos will will find the value of b that makes the two expressions equal for all of the test values in the list represented by x₁. The expressions are linear for the variable x, so we need at least two test values to ensure that the value Desmos finds for b makes the expressions equivalent.
For a graphing approach, enter the two expressions into Desmos, accept the offer of a slider for b, and then manipulate the slider until the graphs of the two expressions are identical; the value of b that makes that happen is your answer. There's no definitive way to ascertain that two graphs are exactly the same, but when you have a multiple-choice problem, there is always enough visual evidence to select an answer nonetheless.
There's another form of SAT problem involving rational expressions that actually asks about equivalent expressions, though this might not be obvious from the form of the question. Here's an example:
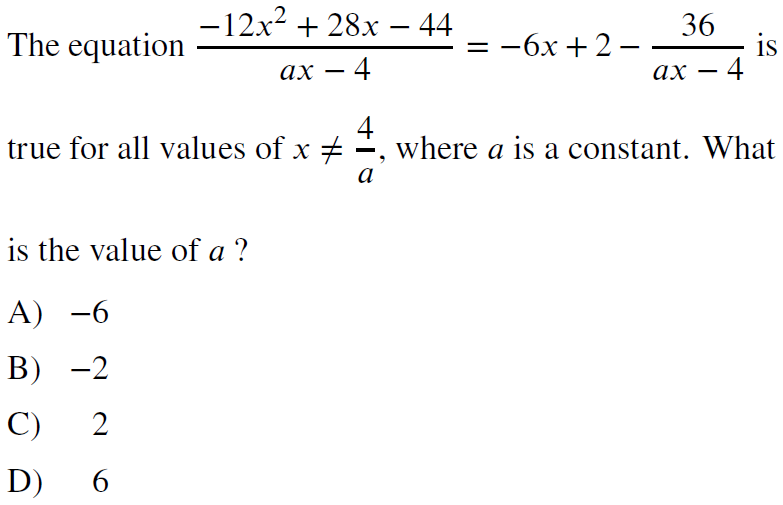
It's important to understand that when it is stated that an equation is true for all values of the variable(s) present, that means that the two expressions are equivalent; these two characterizations have precisely the same meaning.
We can use regression here, but to ensure that Desmos finds a value of a that makes both expressions equal for all values of x, we need to supply several test values of x. The number of such values that are needed to uniquely specify an expression is dependent on the degree of the expression; a quadratic expression, which produces a parabola when graphed, requires three solutions (points) to determine it, so we'll supply a list of three values for x for our regression. Desmos looks for the one value of a that results in the two expressions having the same value for all three values of x.
Alternatively, because the two expressions are equivalent for some value of the constant a, we can use Desmos to graph the two expressions, and we can then set a equal to each of the answer choices to determine which value of a results in the graphs of the two expressions being identical (overlapping everywhere).
A few notes about the Desmos solution shown below:
- Be careful to use parentheses when entering the expressions in order to preserve their structure
- In the graphing approach, after entering the first expression, Desmos will ask if you'd like to add a slider for a₂; accept this offer
- To find the answer, directly enter the values in the answer choices as values for a and observe which value results in the two graphs being identical
- You can use this technique reliably when answering a multiple-choice question, but be cautious when solving a grid-in with this graph-matching approach
18 comments